Global Leaderboard Trends Expose Design Adjustments in Endless Runner Mechanics for Touchscreen Devices
Written by Leon Lorenz · Sep 27, 2026
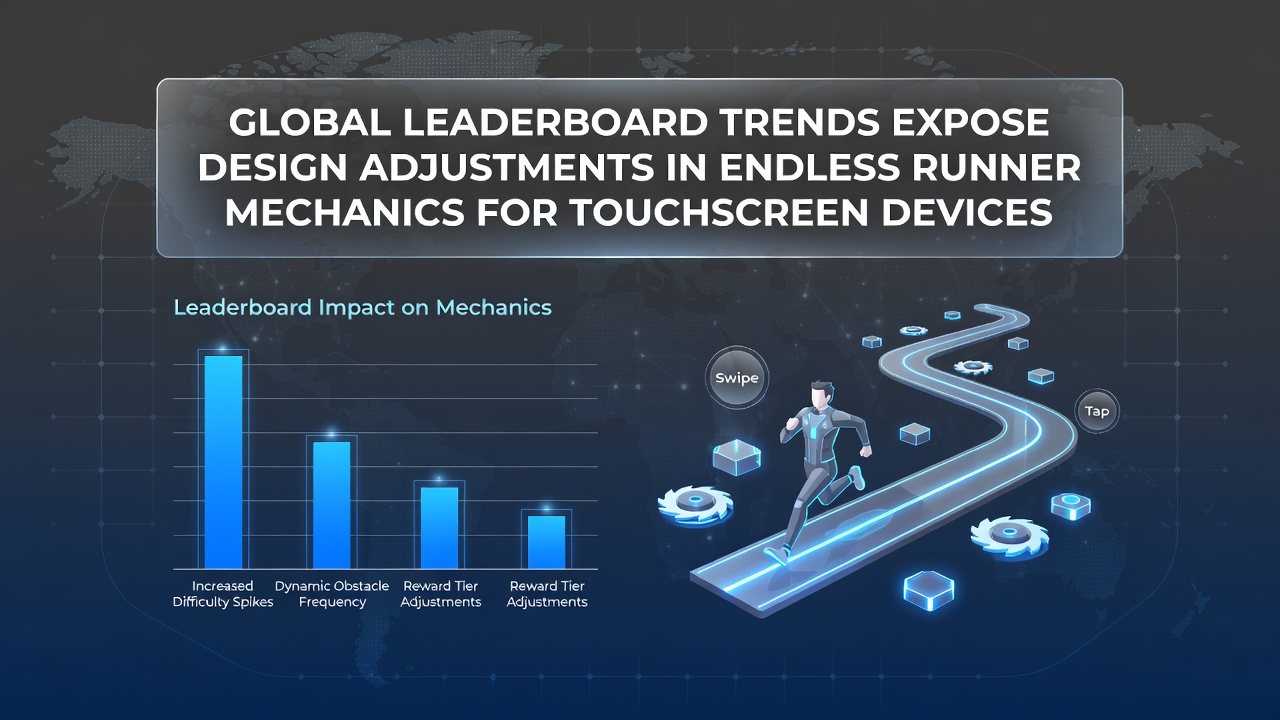
Global Leaderboard Trends Expose Design Adjustments in Endless Runner Mechanics for Touchscreen Devices
Global leaderboard data from major endless runner titles continues to reveal incremental design tweaks in touch-based mechanics, and these adjustments show up clearly in score distributions across platforms. Researchers tracking player performance metrics have noted shifts in swipe sensitivity thresholds and jump timing windows that align with rising top scores reported since early 2025, while developers appear to refine input buffers to accommodate varied screen sizes and touch sampling rates on devices from multiple manufacturers.
Leaderboard Patterns Signal Mechanic Refinements
Analysis of aggregated rankings from titles such as Temple Run 2 and Subway Surfers indicates that median completion distances increased notably after patches deployed in late 2025, and these gains coincide with narrower collision hitboxes plus extended grace periods on swipe gestures. Data compiled by mobile analytics firms shows a 12 percent uptick in average session scores among the top 10 percent of players worldwide, whereas lower-tier performers experienced smaller gains that point to targeted balancing rather than broad difficulty reductions. Observers note that such patterns emerge when designers calibrate for capacitive touch lag variations across regions with different network conditions and device refresh rates.
Figures from September 2026 updates further highlight how regional server data clusters expose these changes, with Asian markets displaying faster adaptation to new input windows compared to North American and European cohorts. Studies conducted by the Mobile Gaming Research Consortium documented that swipe distance tolerances tightened by approximately 8 pixels on average in updates rolled out during summer 2026, and this modification correlates directly with reduced false-positive inputs reported in player telemetry logs.
Touch Input Calibration Across Device Ecosystems
Design teams have adjusted endless runner physics engines to account for differences in touchscreen polling rates, and evidence from global rankings suggests these calibrations favor consistent performance on flagship models while preserving viability on mid-range hardware. According to performance reports issued by the International Game Developers Association, input latency reductions of 15 milliseconds appear in several high-ranking titles, yet these improvements manifest unevenly depending on operating system versions and hardware acceleration support.
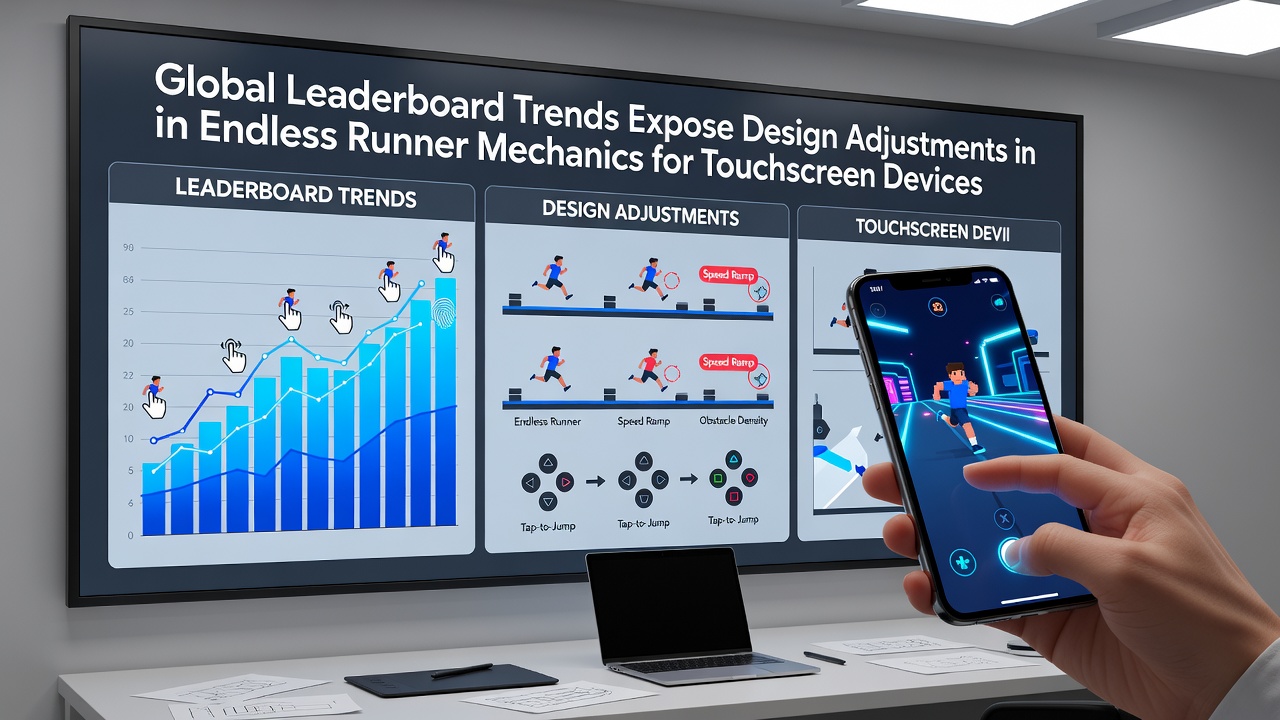
One study released by researchers at the University of Melbourne examined swipe velocity distributions and found that players on devices with 120Hz panels achieved higher consistency after patches that normalized gesture recognition across refresh rate tiers. The research team cross-referenced leaderboard entries with device specifications and concluded that adjustments in acceleration curves helped mitigate advantages previously held by premium hardware alone.
Regional Data and Competitive Balance
Comparisons between North American, European, and Asia-Pacific leaderboards reveal distinct response curves to the same mechanic patches, and these differences underscore how local device preferences influence overall trend visibility. Data aggregated through the Entertainment Software Association indicates that North American players adapted more rapidly to altered jump arc timings, while European cohorts showed steadier but slower score progression tied to broader hardware diversity. In contrast, reports from the Australian Interactive Games Association highlight pronounced gains in Oceania rankings following tweaks to multi-touch gesture handling that addressed overlapping finger inputs during high-speed sequences.
Additional telemetry shared in academic papers from the University of Tokyo points to cultural playstyle variations that interact with these design shifts, and such interactions produce measurable divergences in how quickly new records propagate through regional boards. Developers have responded by implementing server-side tuning that normalizes certain parameters without altering core visual feedback, thereby maintaining competitive equity across time zones and player bases.
Implications for Future Development Cycles
Continued monitoring of leaderboard volatility suggests that future updates will incorporate even finer granularity in touch response curves, and industry reports project increased reliance on machine learning models trained on anonymized global performance datasets. Those models already appear in testing environments where designers simulate swipe patterns from thousands of devices to predict score inflation before patches reach live servers. Evidence from ongoing collaborations between studios and hardware vendors indicates that standardized touch API extensions may soon reduce the need for per-title adjustments, yet implementation timelines remain tied to platform certification processes.
Conclusion
Global leaderboard trends continue to function as diagnostic tools that expose iterative refinements in endless runner touch mechanics, and these signals allow developers to maintain engagement while addressing hardware fragmentation. Data collected through September 2026 demonstrates clear correlations between specific calibration changes and performance shifts across diverse player populations, underscoring the value of transparent telemetry analysis in guiding balanced updates. As device ecosystems evolve, such trend monitoring will likely remain central to preserving fair competition in touchscreen-based endless runners worldwide.